Technical reporting for Windows · CSV + Markdown → PDF, DOCX, HTML

Turn measurement CSV data into a technical report.

Start with measurement or simulation data. MD Visor analyzes the CSV structure, suggests engineering charts and report sections, then generates an editable Markdown report you can export to PDF, Word or HTML.

CSV → Charts → Editable Report → PDF / DOCX / HTML

Get MD Visor — Free See real examples

Free · Offline · Windows 10/11 · Your files stay local

MD Visor
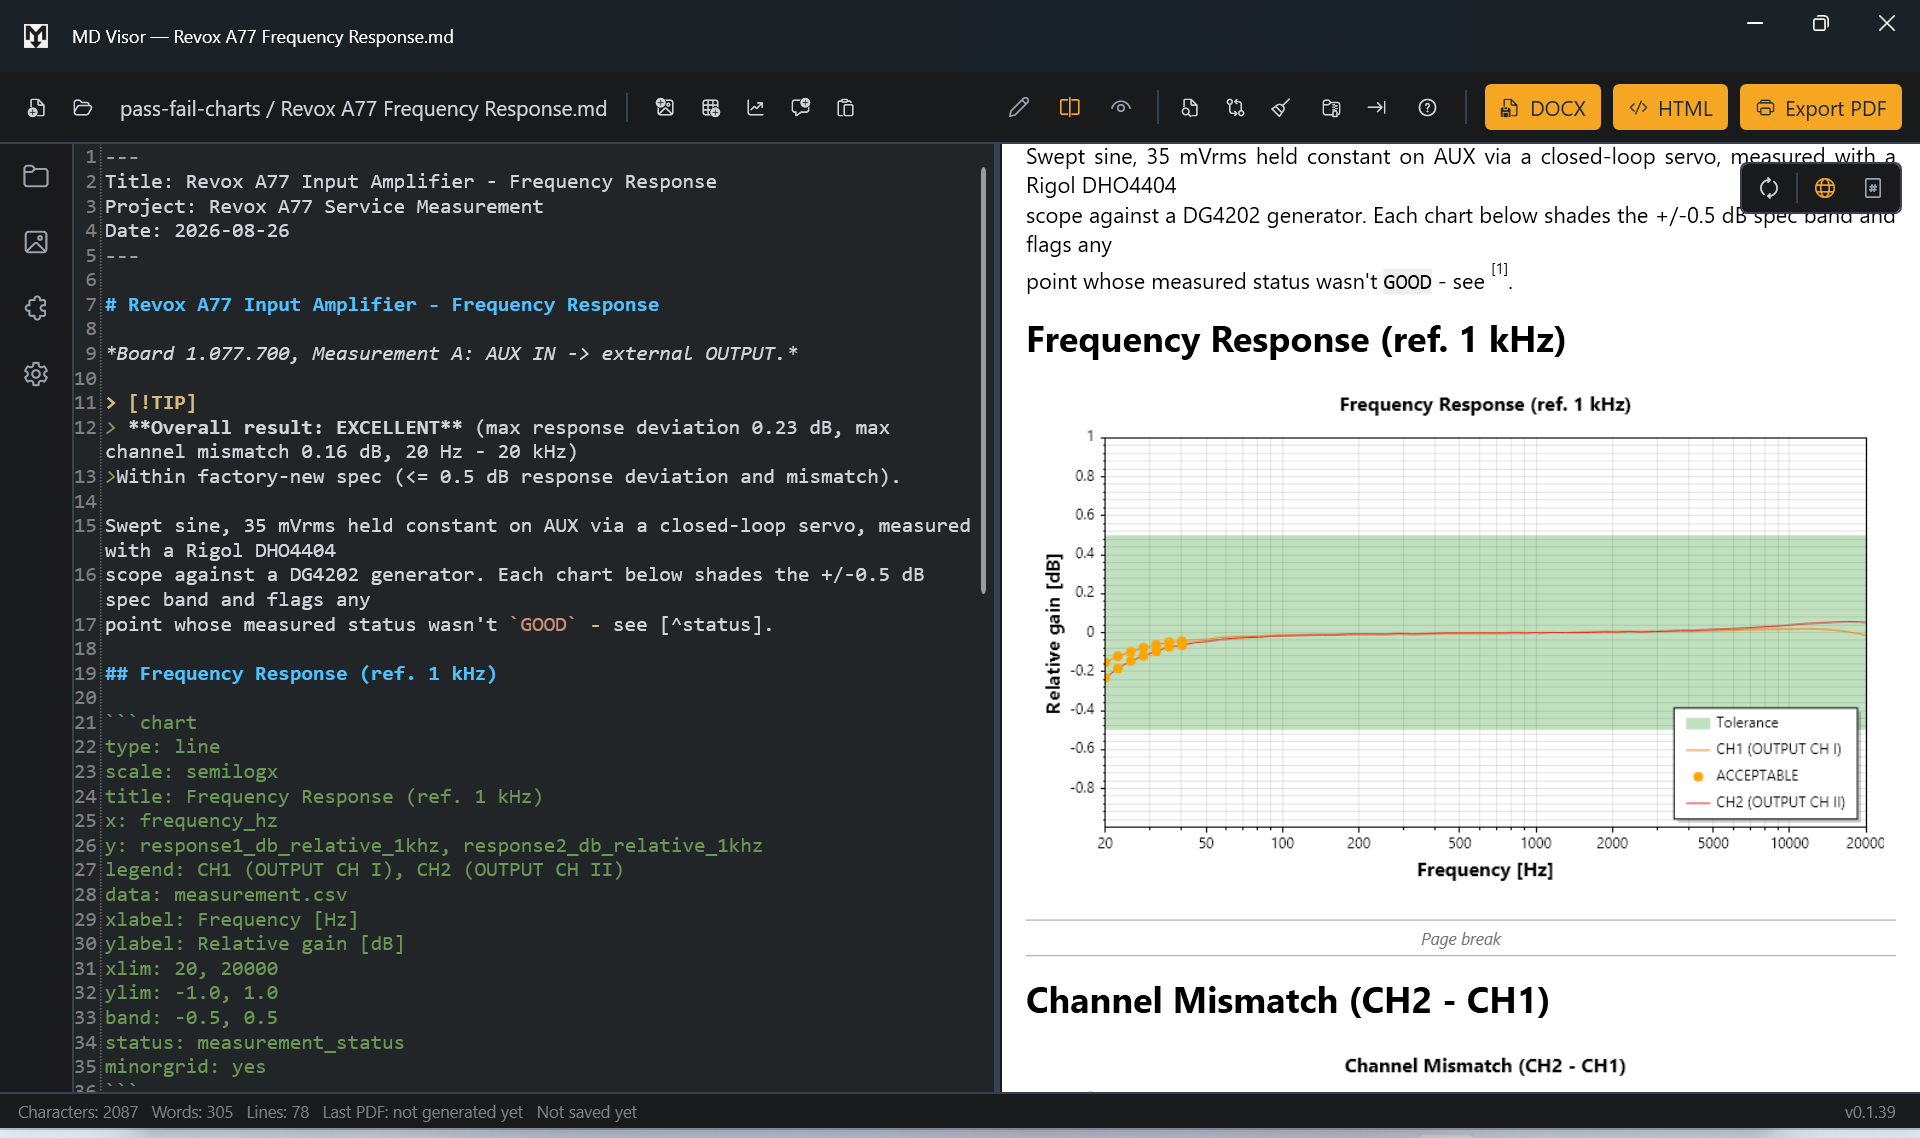
MD Visor technical measurement report with Markdown editor and live engineering chart preview

Start with the data, not a blank page.

Select one or more CSV/TSV files and let MD Visor suggest a report structure based on their columns and data types. Review the proposed charts and tables, then create a normal editable Markdown document.

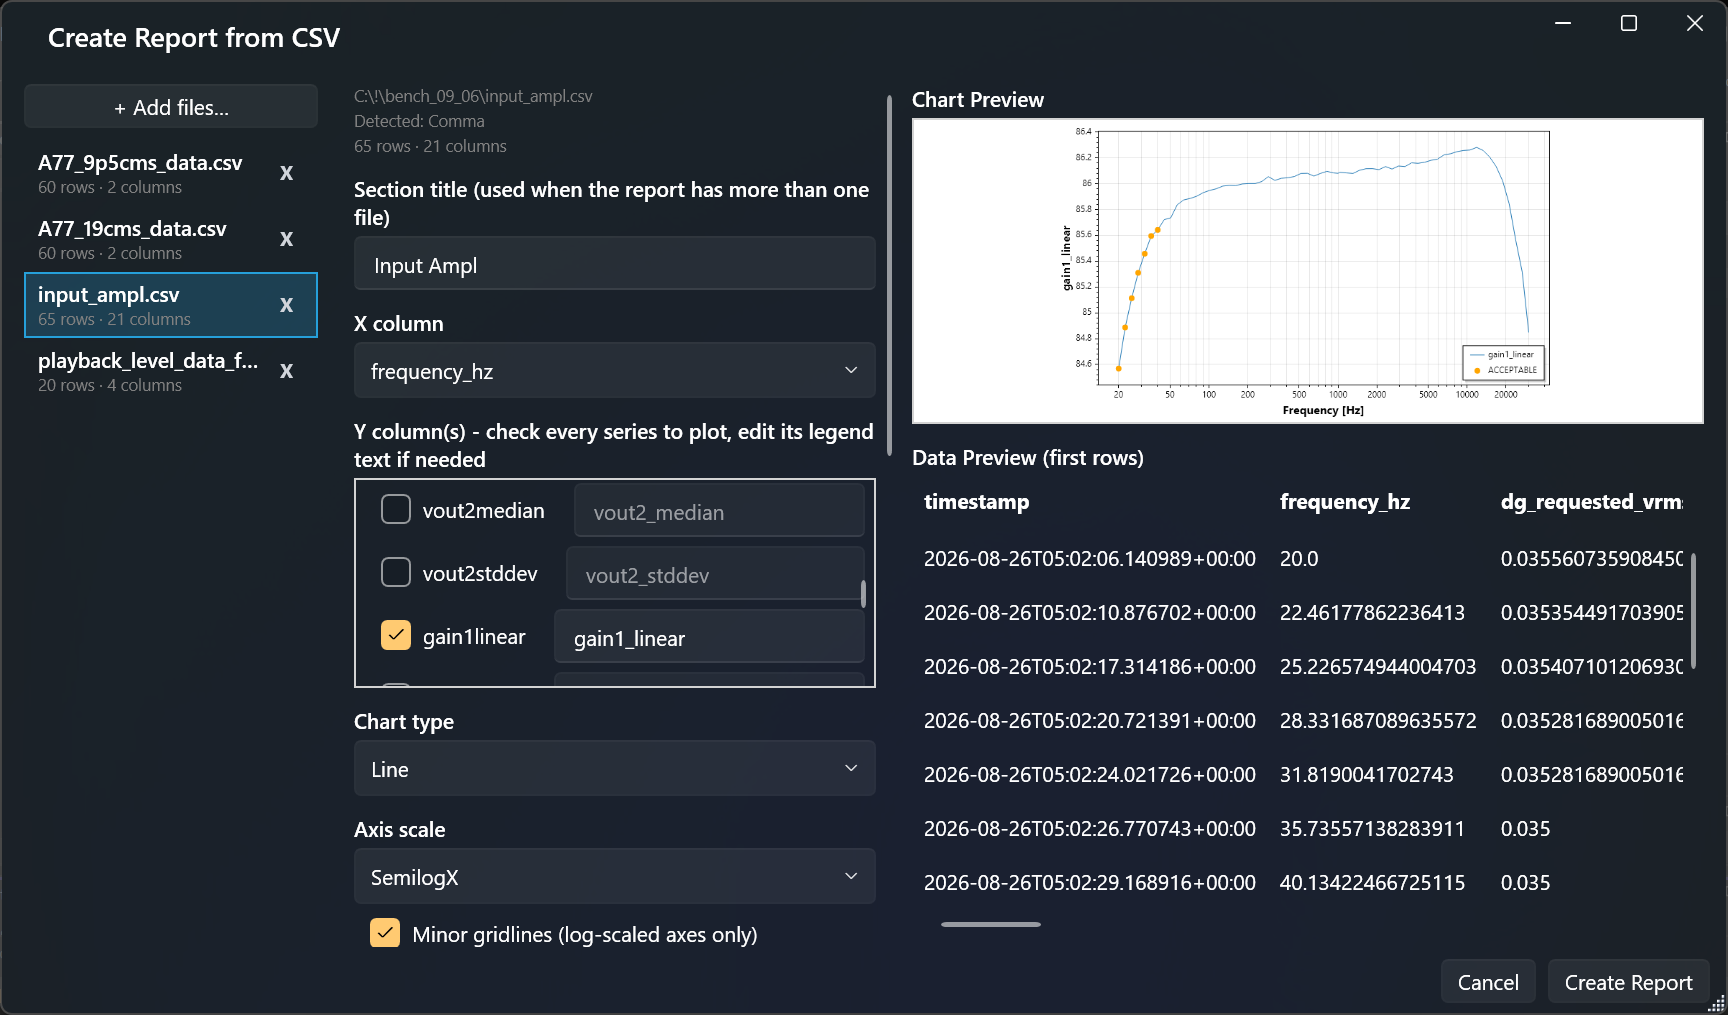
MD Visor Create Report from CSV wizard - file list, suggested X/Y columns and chart settings on the left, live chart and data preview on the right

Create Report from CSV - each file gets its own suggested X/Y columns, chart type and axis scale, with a live preview before anything is created.

1. Select CSV / TSV

Add one or more measurement or simulation data files - mixed delimiters are detected and normalized automatically.

2. Review suggested charts

MD Visor suggests X/Y columns, chart type and axis scale per file, with a live chart and data preview to adjust before creating anything.

3. Edit and export the report

The result is a normal, fully editable Markdown document - refine it like any other report, then export to PDF, DOCX or HTML.

Combine measurement data from different sources in one report - MD Visor imports and normalizes multiple CSV/TSV files into a consistent report dataset. See how it works in the Manual.

Measure. Document. Export.

CSV / measurement data
Charts & tables
Markdown documentation
PDF · DOCX · HTML

Bring your data

Use CSV measurement or simulation data directly in tables and engineering charts, or simply insert photos and screenshots straight from your instruments and simulations. Linked CSV data can stay connected to its source file as measurements change.

Document the results

Add explanations, images, LaTeX equations, Mermaid diagrams, notes and cross-references while keeping the source as readable plain-text Markdown.

Deliver the report

Export the finished document to print-accurate PDF, native Word DOCX, or a self-contained HTML file.

Built for technical reports

MD Visor combines plain-text Markdown with the things engineering documents actually need: measurement data, charts, tables, equations, diagrams, figures and cross-references. Your Markdown remains the source of truth while MD Visor handles live preview and document export.

It is designed for measurement protocols, test reports, laboratory documentation, engineering notes and similar documents where data and explanation belong together.

Looking for LaTeX or a WYSIWYG page designer? See the FAQ for what MD Visor is and is not.

What MD Visor does

Measurement data & engineering charts

Work directly with CSV measurement and simulation data. Select the columns you need, create tables, statistics or engineering charts, and keep linked data live when the source file changes. Frequency-response and other engineering plots can use logarithmic axes, limits and measurement-oriented chart options.

Technical reporting

Combine measurement results with Markdown text, images, LaTeX equations, Mermaid diagrams, tables and automatically numbered cross-references in one document.

Print-accurate layout

Switch to the paginated Print Layout to see how the final PDF will look before export - including page breaks, headers and page numbers.

PDF, DOCX & HTML

Export the same technical document to print-accurate PDF, native Word DOCX, or a self-contained HTML file. Free to use, no subscription - all export formats included.

Markdown stays yours

The document source remains ordinary readable Markdown. No proprietary visual document format is required to edit the report, and the source stays inspectable as plain text.

Images, diagrams & formulas

Drop in photos and screenshots from instruments or simulations, add Mermaid diagrams and LaTeX-style mathematics - all render directly in the live preview and exported output.

Cross-references

Label figures, equations and tables once and reference them by number anywhere in the text - numbering updates automatically, and every reference is a clickable link in the exported PDF.

Your own document style

Use a JSON style profile to control fonts, sizes and colors consistently across Web View, Print Layout and PDF export - start from one of five ready-made looks or build a style →.

Share your setup with a team

Bundle document style, page setup, snippets and your header logo into a single file - export it once, then import it on a colleague's machine or your next computer so everyone's reports match.

Track Changes

Review the difference between the current document and a baseline you control, independent of autosave.

AI-paste cleanup

Paste text from AI assistants while automatically normalizing smart quotes, em dashes, invisible characters and other unwanted text artifacts according to your cleanup settings.

Portable document packages

Bundle a report with the images and CSV files it references into a single .mdv package for transfer or archiving.

Crash & data protection

Autosave, safe atomic writes and automatic crash recovery protect your work throughout - a forced shutdown or power loss won't leave a corrupted file or lost edits behind.

Works offline. Stays local.

Rendering and document processing happen locally on your computer. No account or cloud upload is required to work with your documents and measurement data.

Your measurement data and documentation stay connected.

Reference CSV data directly from the document instead of copying values manually into a separate publishing workflow. Use the same source data for charts, tables or statistics, and let linked data refresh when the source file changes.

Instrument / Simulation / Logger
CSV
MD Visor
Charts
Tables
Text
PDF · DOCX · HTML

Common data sources: measurement instruments, simulation exports, data loggers, Python-generated CSV, LTspice tabular export.

Built for real technical work

Measurement & test protocols

Document instrument measurements, plots, tables, limits, notes and conclusions in one report.

Simulation reports

Turn exported simulation data into charts and combine the results with formulas, explanations and diagrams.

Laboratory reports

Keep raw data, engineering plots and written observations together in a reproducible technical document.

Engineering documentation

Combine design notes, diagrams, equations, images, tables and measured results in one Markdown-based source.

See real MD Visor examples →

Turn your data into a technical document.

Start with Markdown, bring in CSV measurement data, add charts and technical content, then export the finished report.

Get MD Visor — Free Read the manual