Bode/FRA measurement for Windows · Rigol DHO4404 + DG4202 over LAN
Automated Bode plots, without a dedicated FRA box.
Bode Lab drives a Rigol signal generator and oscilloscope over LAN to sweep frequency,
capture gain and phase, and plot the result - the kind of frequency-response measurement
normally reserved for dedicated (and expensive) FRA hardware.
DG4202 → DUT → DHO4404 → Gain/Phase plot
Also supports the wider Rigol DHO4000 (12-bit), MSO/DS1000Z/2000/4000/6000/7000 (8-bit), and
DG4000-series generator families - see the FAQ for details.
Free · Offline · Windows 10/11 · No VISA runtime required
Bode Lab
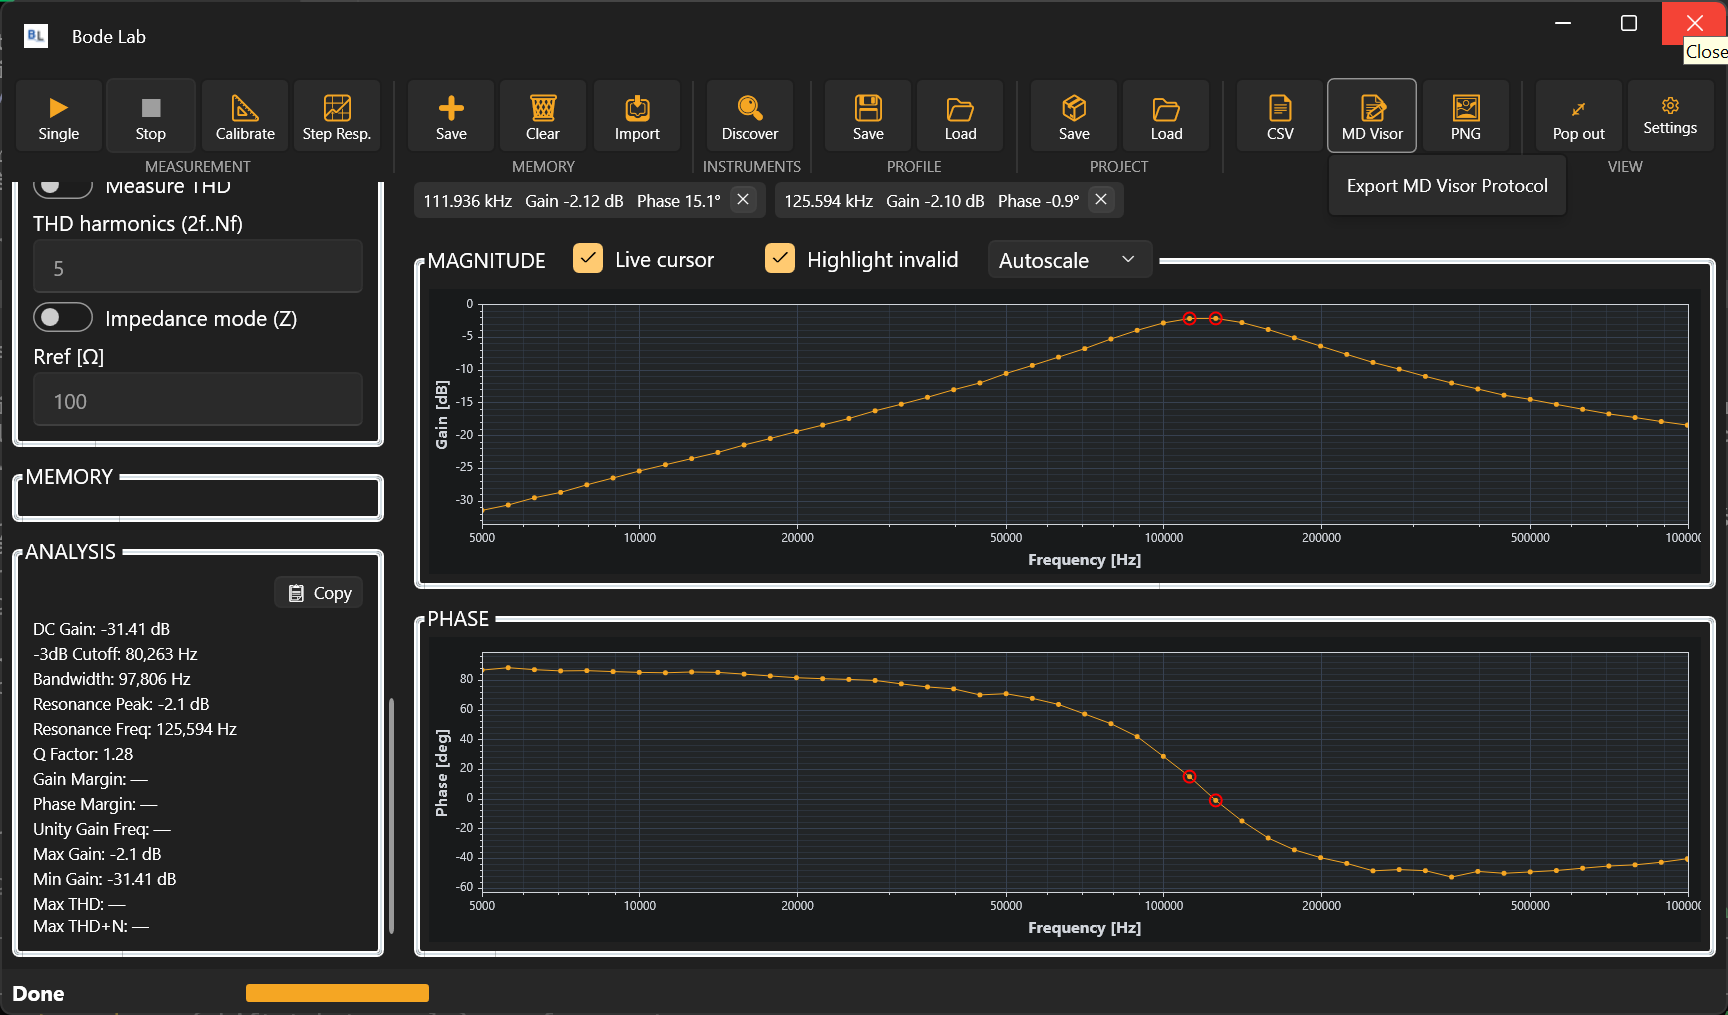
Live sweep, cursors, and automatic analysis. Magnitude and phase plotted side
by side, cursors dropped on the resonant peak, and the Analysis panel calling out
−3 dB cutoff, bandwidth, resonance frequency, and Q factor as the sweep runs.
What's a Bode/FRA measurement?
A Frequency Response Analyzer (FRA) measures how much a circuit's output amplitude (gain) and
timing (phase) shift relative to its input, at each frequency across a sweep - the result is a
Bode plot: gain [dB] and phase [deg] plotted against frequency.
It's the standard way to check a switching power supply's feedback loop stability, find a
filter's cutoff and rolloff, or characterize how a load's impedance changes with frequency.
Dedicated FRA instruments (Bode 100, Venable, Omicron) do this in hardware and cost real
money; Bode Lab does the same sweep in software, driving a Rigol generator and scope you may
already own.
One sweep, gain and phase together
Set a frequency range and hit Single, and Bode Lab steps the generator through a log or
linear sweep, reads the response back from the scope at each point, and plots Gain [dB] and
Phase [deg] against frequency as it goes.
THRU calibration
Remove the fixture/cable contribution from the measurement before characterizing the
actual device under test.
Memory & overlay traces
Save a sweep and overlay it against a later one, or import a CSV trace as a reference -
compare before/after changes at a glance.
Auto-range & averaging
Vertical scale adjusts automatically as gain changes across the sweep; optional
averaging trades speed for a cleaner trace.
Beyond a plain Bode plot
STEREO / 2-channel measurement
Measure both channels of a stereo device in one sweep and see the channel mismatch
directly.
Impedance mode Z(f)
Reinterpret the same measurement as impedance magnitude against frequency, for filter
and load characterization.
THD (harmonic distortion)
Measure harmonic distortion at a chosen frequency alongside the regular sweep.
Step response / slew rate
Switch to a square-wave stimulus and read the time-domain step response directly from
the same instrument pair.
Cursors & automatic analysis
Drop markers on the curve and get automatic call-outs for things like -3 dB
bandwidth and resonant peaks.
Export to MD Visor, CSV or PNG
Hand the finished measurement straight to MD
Visor as a ready-made protocol section, or export the raw data/chart image.
 Bode/FRA measurement for Windows · Rigol DHO4404 + DG4202 over LAN