Getting started
Press F1 in AudioLab to open this page.
Your path, in this order:
- Try it without hardware – the simulator, five minutes: First steps.
- Calibrate in volts – your interface and a multimeter, a quarter of an hour: Calibration.
- Measure your interface in a loop – its floor is what every later result is read against, an hour: Measure your interface first.
- Measure your device with its guide: a headphone amplifier, a USB audio card, any other under Devices.
You need: an audio interface with an ASIO driver – four inputs measure a stereo device with its references at once, two a mono one – a true-RMS multimeter, and cables with Y splitters; for amplifiers a load box, for phono stages an attenuator. Look things up later: Tasks, Levels, Reading the charts.
How AudioLab measures
AudioLab plays a test signal from the interface output into the device under test and records two points at the same time: the signal before the device (reference) and after it (output). Comparing them shows what the device did to the signal. The reference also shows the floor of the measurement path – the distortion and noise of the generator and converters themselves; a device result close to it is limited by the setup, not by the device.
Every result rests on documented methods (Methods): both channels and their references are captured synchronously, so each figure carries the floor of the measurement path beside it; calibrated inputs give results in V, dBV and dBu; and every algorithm is checked against signals with known values from the built-in simulator (how the calculations are checked). With a four-input interface such as the MOTU M4 that floor lies well below what amplifiers, tape recorders and turntables produce. The examples in this manual are real devices, measured exactly as described; they show what each result looks like and how to read it.
A four-input interface such as the MOTU M4 has room for the reference and output of both channels, so stereo devices are measured left and right at once. Without a reference: an external DAC (the signal plays over USB), a player with AudioLab's test file and a test tape – only the output is measured there, tone levels without phase.
Audio runs through the driver supplied by the manufacturer of the audio interface (an ASIO® driver, for example from MOTU). Without an interface, choose AudioLab Simulator (no hardware).
 ASIO is a registered trademark of Steinberg Media Technologies GmbH
1 · First steps without hardware
- CONNECTIONS: Audio interface = AudioLab Simulator (no hardware), Simulated device = Power amplifier + attenuator, Wiring = Stereo.
- MEASUREMENT → THD+N meter; SIGNAL: 1000 Hz, −20 dBFS.
- Press RUN. The chart shows the tone, harmonics and hum; the bar shows THD+N of both channels. Tick Details for the full table.
- Press R to hide the right channel, and again to show it.
- STOP, task THD vs level, SINGLE: distortion grows with the level.
- Try Simulated device = Tape recorder with Speed & flutter (tick Play test signal) and Tape response.
The simulated devices have known properties (listed under the device choice), so you know what AudioLab should measure.
2 · Calibration in volts
Without calibration every level is in dBFS. Calibration tells AudioLab how many volts 0 dBFS is on each input, so levels, noise and gain read in volts, dBV and dBu. It is stored separately for each audio interface. You need a true-RMS multimeter (AC volts) and a cable from OUT 1 (OUT 3 with outputs 3–4); no divider in the path.
- CALIBRATION → Calibrate… opens a wizard; a running measurement stops. The inputs of the wiring are preselected; Start.
- One step per input: connect the output straight to that input with the multimeter across the same connection (tip to ring for TRS, tip to sleeve for TS or RCA). AudioLab plays 1 kHz at −10 dBFS; green Clean test tone means ready. Type the multimeter reading (
0.388,0,388or388 mV) and press Save & next. - The outputs are calibrated from the same readings.
- Summary: volts at 0 dBFS for every input and output, and the Divider [dB] column – enter it when you measure through an attenuator (a power amplifier on a load, e.g. 20 dB for 10 : 1) and type 0 when it is gone. Delete calibration removes an input's calibration (not its divider).
Only what changed is saved, so a second AudioLab window does not overwrite a newer calibration. Readings show volts for every calibrated input; for the chart in dBV tick Settings → Chart → Show levels in volts. Check with the Level meter: the input shows the multimeter's voltage. Do not move the interface's gain knobs afterwards – AudioLab warns when the reference stops matching its calibration.
Next: 3 · Measure your interface first, then your device's guide.
Controls
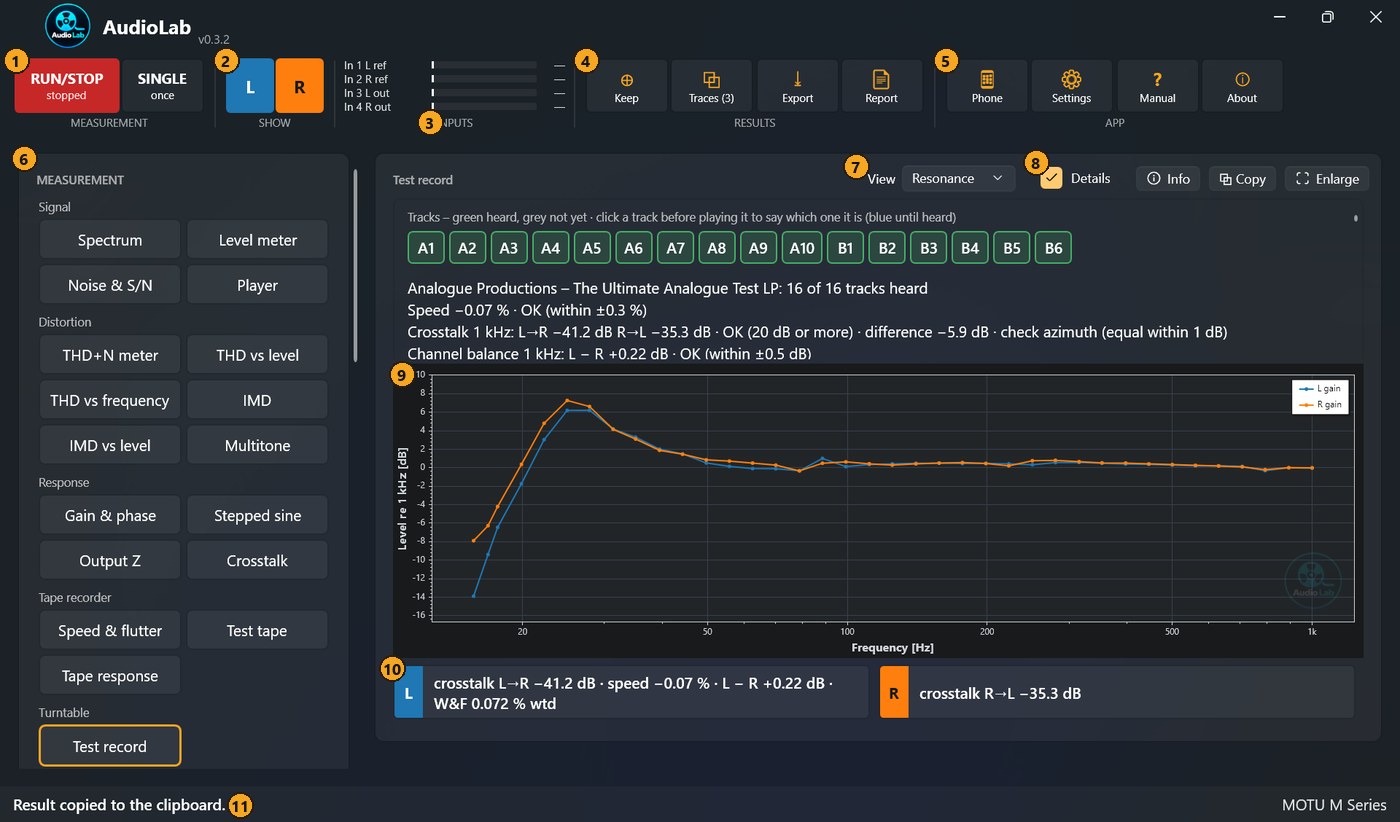
The numbers match the table. Below the task list (6) the left panel continues with SIGNAL, ANALYSIS, CONNECTIONS and CALIBRATION – scroll it down.
| Control | What it does |
|---|---|
| 1 RUN/STOP | A measurement that repeats until pressed again (green running, red stopped); a sweep repeats the whole sweep. |
| 1 SINGLE | One measurement (or one sweep pass), then the result is held. |
| 2 L / R, REF | Show or hide a channel (L blue, R orange) or the reference curves (purple). Both channels and the reference are always measured. |
| 3 INPUTS | Live levels of the four inputs during any measurement, named by their role in the wiring: the bar is the RMS over 300 ms, the tick and number the peak in dBFS. A row turns red above −1 dBFS. |
| 4 Keep, Traces, Export, Report | Keep the result as a trace to compare, save it, write a report – see Results. |
| 5 Phone | The measurement bar on a phone in the same network, with the RUN/STOP, SINGLE and REL keys – for reading a figure and starting a measurement at a trimmer or a turntable away from the screen; untick The phone may press RUN/STOP, SINGLE and REL in the window and it only reads. A window shows a QR code and the address: open it on the phone, which then shows the bar’s main figure large, the rest under it and an OK / check frame, four times a second. The button shows while it serves; AudioLab listens on a port from 8770 to 8779 and needs no administrator rights (allow it if Windows asks about a private network). The address carries a key, new at every start, so other devices in the network cannot read or press anything; nothing goes beyond the local network, and Stop readout ends the server. |
| 5 Settings | General (theme, CSV), Audio (output limit, generator outputs), Analysis (FFT, averaging, band and harmonics, THD+N or SINAD, sweeps, tape transport), Chart (volts, fixed level axis, unlit digits). |
| 6 MEASUREMENT (left panel) | The list of tasks: pick what you want to find out; the task sets the analysis, the test signal and whether it is a sweep. |
| 7 Keys above the chart | Log f, Peaks, Spectrogram (spectra), Scope, dBc (THD+N meter, IMD), Spectrum (Speed & flutter), Large, REL, Max hold, Balance, Zoom (Level meter), View (Test record), X / Y (sweeps) – they only change the chart; see each task's page. |
| 8 Info, Details, Copy, Enlarge | What the task does and every cable of the wiring; the results beyond the bar (they take at most about a third of the room and scroll, the chart keeps the rest); the result as text; the chart in its own window. |
| 9 Chart, crosshair | Mouse over the chart: the values of all curves; on a spectrum it snaps to the nearest peak. |
| 10 Measurement bar (under the chart) | The key numbers of each channel, as on an instrument's display: fixed positions (unused ones as faint 8s), the main result bold, every number explained under the mouse, dashes for a missing value, a sign where a deviation can go either way. A long line wraps. |
| 11 Status line | What runs now, warnings in red (clipping, a missing reference); on the right the audio interface. |
Every measurement follows the same steps:
- Connect the device and choose the audio interface and the wiring in CONNECTIONS.
- Pick a task in MEASUREMENT.
- Set frequency and level in SIGNAL (what the task does not need is hidden). The level is shared by all tasks: check it when you change the device – which level for which task.
- Press RUN (continuous) or SINGLE (once).
- STOP holds the result; then Keep it as a trace, Export or Report.
The task switches the generator on by itself – check the level first. Spectrum, Level meter and Speed & flutter have Play test signal, so they can analyse an external signal; Player and Test tape never play.
Connecting a device
CONNECTIONS → Wiring says what each input carries; under it AudioLab lists every cable for the present settings, from → to. Take the reference with a Y-cable as close to the device input as possible. A power amplifier never goes straight into the interface – always through a load and a divider, entered as Divider in the calibration. CONNECTIONS → On the device output says which load is connected (for power in W and Output Z).
Every wiring with diagrams and what the reference does: Wiring and reference · what the levels mean and which one to play: Levels · step by step for each kind of device: Devices.
Tasks
Every task in short – what it is for, how to run it and what the bar shows – with a link to its own page: Tasks. Which tasks to run for a particular device: What to measure.
Results: save, compare, export, report
What each chart shows, which line is which (solid, dashed, dotted) and the other views: Reading the charts.
- STOP (or the end of SINGLE) keeps the last result; the channel keys still redraw it.
- Keep keeps the curves as a dashed trace over later measurements with the same kind of chart. Traces (n) opens the panel: show, rename, 📌 Pin (a trace that shows by itself whenever this task runs on this interface – how the interface floor is kept), Save… as an
.audiolabfile, Load file…, Remove. Traces stay after a restart. - Export saves the numbers as CSV with the conditions in
#lines (in stereo the first column is L/R), or the chart as PNG / SVG, light or dark. - Report creates a protocol for MD Visor: a folder with
report.md, the data and the chart. ReplaceDUT: (device under test)with the device, add your verdict and export to PDF; keep MD Visor's CSV delimiter on Comma. - Copy copies the result as text; Enlarge moves the chart to its own window (a second monitor).
Settings and files
- Theme: Blueprint Light or Studio Dark. CSV export: comma and decimal point, or semicolon and decimal comma (Excel with European settings).
- Generator output limit (−40 to 0 dBFS, −6 dBFS until you change it): no task, sweep or slider plays louder. Set a low limit before connecting speakers or sensitive inputs. −3 and 0 dBFS reach the interface’s full scale and are marked with a warning: they are for line inputs and converter tests.
- Settings, calibration, loops and traces are stored under
%LocalAppData%\AudioLab. After an unexpected error AudioLab stops, shows a message and writes the details to%LocalAppData%\AudioLab\logs– attach that file when you report a problem. Nothing is sent anywhere.
Safety and common mistakes
- Most tasks play the test signal as soon as you press RUN or SINGLE – check the level first, or set a low output limit.
- Power amplifiers only through a load and a divider, never directly; bridged (BTL) amplifiers not against ground.
- Input clipping detected: reduce the level; results measured while clipping are invalid.
- Device results close to the reference are limited by the measurement path.
- Recalibrate after moving the interface's gain knobs.
- 50/100/150 Hz hum is often a ground loop, not the device: try another power outlet or balanced cables.
- If a channel shows nonsense, check Wiring – the cables listed under it (and in Info) say which input should carry what.
F1opens this manual.
Glossary
| Term | Meaning |
|---|---|
| dBFS | decibels relative to the converter's full scale (0 dBFS = maximum) – more |
| dBV, dBu | decibels relative to 1 V RMS, and to 0.775 V (dBu = dBV + 2.22); after calibration |
| dBc | decibels relative to the tone (harmonics, IMD products) |
| Reference | the signal before the device; shows the measurement path itself |
| THD, THD+N, SINAD | total harmonic distortion; with noise; signal over noise and distortion in dB |
| IMD | intermodulation distortion of two tones |
| S/N, dynamic range | signal-to-noise ratio; full scale over the noise beside a quiet tone (AES17) |
| Crosstalk, separation | leak of one channel into the other; separation is its negative in dB |
| FFT, bin, window, ENBW | frequency analysis; one frequency slot of width Δf; block shaping before the FFT; noise bandwidth of one bin |
| Coherence | reliability of a response point (1 = excellent) |
| Wow, flutter, azimuth | slow and fast tape speed variation; tilt of the head gap, seen as a delay between channels |
| Jitter | timing error of a converter's clock; the J-test shows it as sidebands around a tone |