LAN · SCPI over TCP
Enter an IP address and SCPI socket port, or discover instruments on the local network. The device must support raw TCP SCPI; use the port in its programming manual (often 5555).
Connect over LAN → SCPI data logging for Windows · LAN / USB / Serial
Connect a multimeter, power supply, electronic load, LCR meter or frequency counter. Choose the readings, watch them live and record how they change over time.
Local data · No VISA runtime required · Get it from Microsoft Store
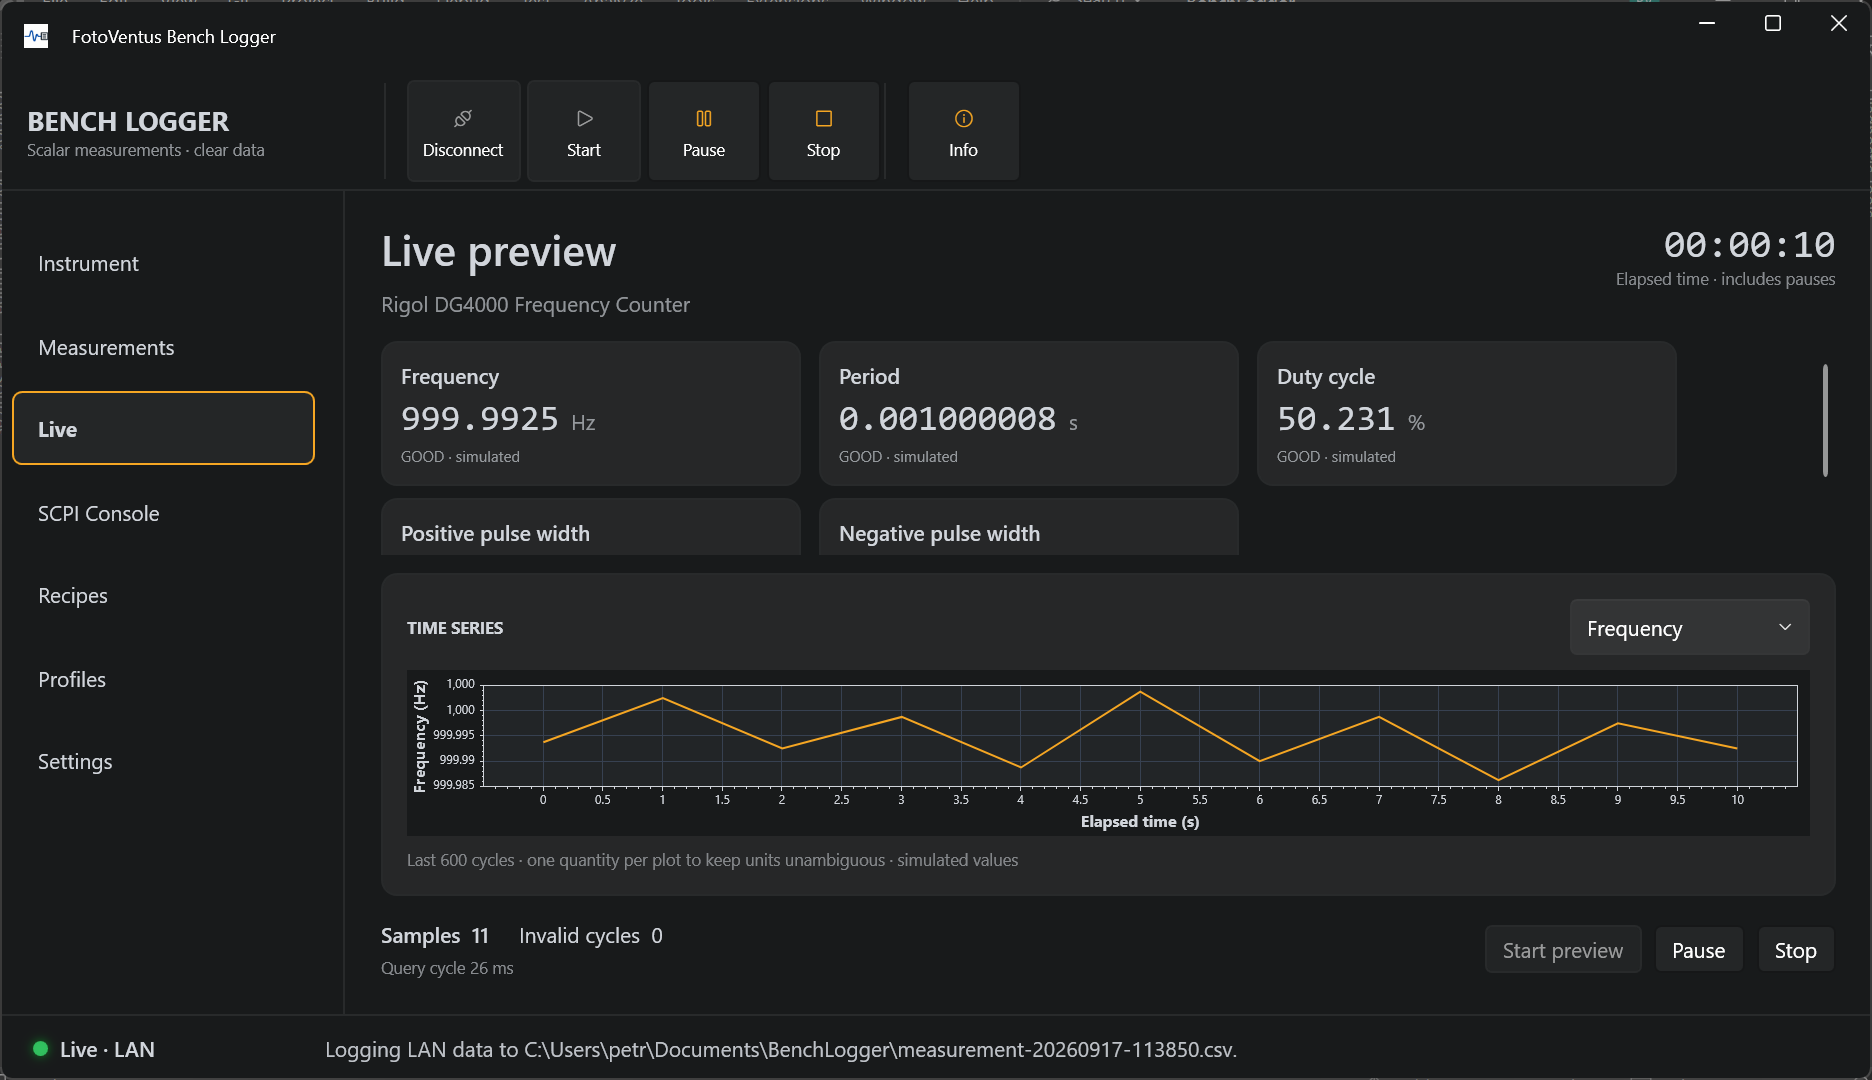
Live values and trends while readings are written to CSV.
Enter an IP address and SCPI socket port, or discover instruments on the local network. The device must support raw TCP SCPI; use the port in its programming manual (often 5555).
Connect over LAN →Connect a compatible USBTMC instrument directly. Bench Logger uses the Windows WinUSB driver; Zadig can bind it to the selected instrument.
USB driver walkthrough →Use a physical serial port or a USB device exposed as a virtual COM port. Select its COM number and baud rate. Text SCPI uses 8 data bits, no parity, one stop bit and LF line endings.
Connect over serial →Explore the measurement workflow, live view and CSV output before connecting a real instrument. Simulated values do not validate a hardware profile.
Try the simulator →Select quantities, set the query interval and follow changes over time. Pause and resume without starting a new experiment.
Save readings with timestamps, units and validity status. Set sample or duration limits, rotate files and use reconnect for LAN or serial sessions.
A JSON profile describes the instrument. A recipe remembers the selected readings and logging settings for your experiment.
Bench Logger writes your selected readings directly to a CSV file while measuring. Each row includes a UTC timestamp, elapsed time, sample number, validity status and the measured values. Keep the raw data for later comparison, analysis or documentation.
Continue in MD Visor: use Create Report from CSV to turn a recording into charts and tables, add your setup description and conclusions, and export a report to PDF, DOCX or HTML. CSV also works with spreadsheets and your own analysis scripts.
Bundled profiles cover Rigol DM3058E, DP832A, DL3021A, the DG4000 frequency counter and ZC ET44/ET45 LCR meters. Support depends on the instrument's commands and transport; each new model needs a check on real hardware.
A profile maps SCPI replies to named values, units and CSV columns. Extend that mapping in the Profile Editor, or write the JSON yourself using the profile guide.
Like Bode Lab, Bench Logger aims to avoid bloatware and take the most direct practical path: SCPI over a TCP socket, USBTMC through WinUSB, or text commands over a COM port. No large vendor control suite or VISA runtime is required for these connections.
The focus is a small, understandable workflow: connect, measure, save. Data stays on your computer. USB still needs the appropriate device driver; the illustrated Zadig guide walks through that one-time setup.