Bench Logger – User Manual
Bench Logger is a Windows WPF application for text-based SCPI measurements from laboratory instruments. Connect over LAN, USBTMC with WinUSB, or a serial COM port; values are shown live and written to CSV. A simulator is available for trying the workflow without hardware.
- Start the application and select LAN on the Instrument page.
- Enter the instrument IP address and port, usually 5555, or use Discover LAN.
- Select the matching instrument profile and click Connect.
- On Measurements, select quantities, set the interval, and choose a CSV path.
- Optionally set acquisition limits, then click Start preview.
- When the run ends, inspect the CSV file and run log in the selected folder.
Application sections
| Section | Purpose |
|---|---|
| Instrument | LAN, USB, Serial and Simulator modes, connection settings, discovery, profile, instrument identity and explicit profile commands. |
| Measurements | Quantity selection, interval, CSV file, sample and duration limits, and stop-on-INVALID. |
| Live | Current values, state, sample/error counts, chart, Pause/Resume and Stop. |
| SCPI Console | Manual text query and raw response history for diagnostics. |
| Recipes | Save and reload a profile, selected quantities, interval, CSV path and acquisition limits. |
| Profiles | Loaded profiles and import of a custom JSON profile. |
| Settings | Theme, auto reconnect, retry limits, file rotation and run log path. |
LAN uses a raw SCPI TCP socket. LXI discovery helps find instruments; it does not add VXI-11 or HiSLIP transport support.
First LAN connection
- Make sure the computer and instrument are on the same network.
- Choose LAN under Instrument → Transport.
- Enter the IP address directly. The usual port is 5555; follow the instrument manual if it differs.
- If the address is unknown, click Discover LAN, select a result and click Connect.
- After connecting, Bench Logger sends *IDN? and matches the response to a profile.
If no profile matches, check the actual identity response in the console and adjust idn_contains in the profile.
USB connection
The USB transport talks to USBTMC instruments through WinUSB. A USB cable alone is not enough: Windows must bind the instrument's USBTMC interface to that driver. Devices that appear as a COM port use Serial instead.
- Connect and power on the instrument. If WinUSB is not installed for it, follow the Zadig steps below.
- In Instrument, choose USB and scan for USB instruments.
- Select the device and click Connect. Check the identity and selected profile.
- Select your readings under Measurements, choose a CSV path and start.
Set up WinUSB with Zadig
Zadig installs a generic USB driver for a selected device. The example below uses a Rigol multimeter listed as DM3000 SERIES. Your model name and USB IDs may differ.
1. Identify the instrument
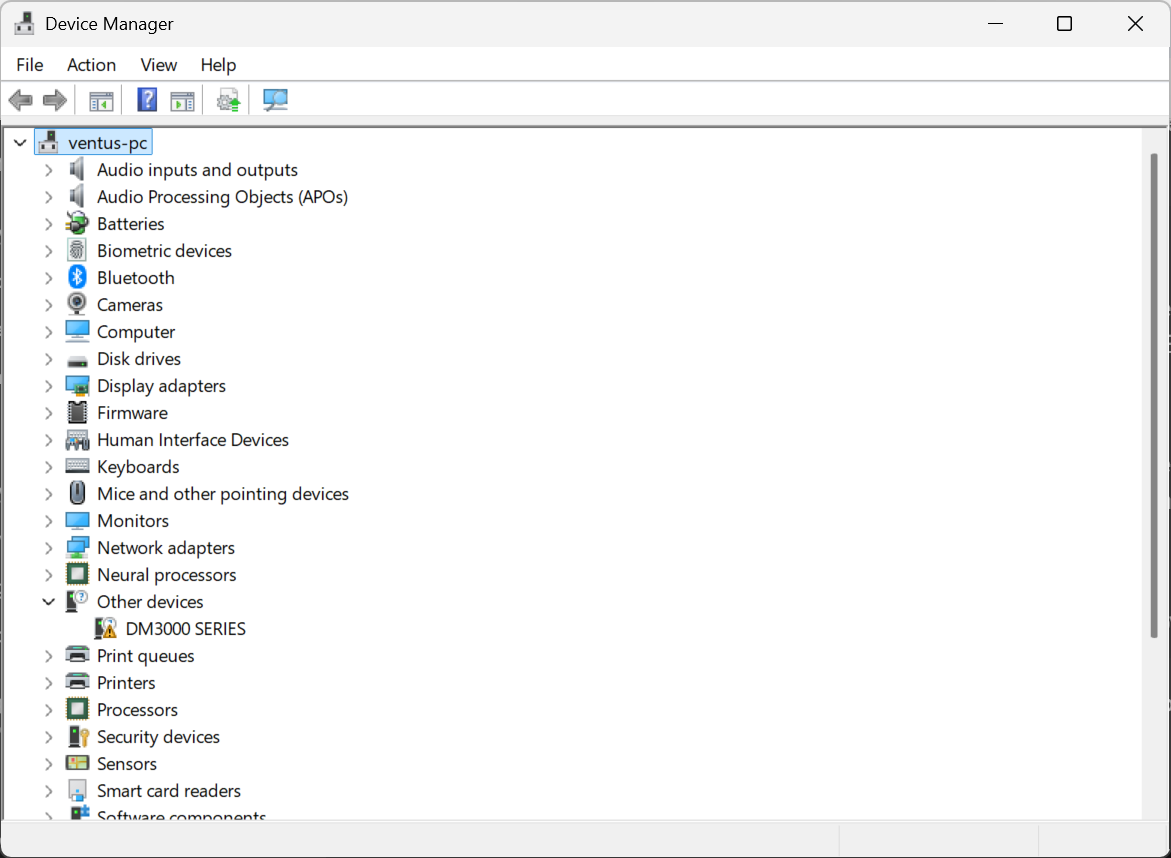
Open Windows Device Manager after connecting the instrument. In this example it appears under Other devices with a warning icon. Check its name and, under Properties → Details → Hardware Ids, its vendor/product IDs.
2. Select that device and WinUSB
Download Zadig from its official website and allow the administrator prompt for driver installation. Choose Options → List All Devices if the instrument is not listed. Select the instrument, verify the USB IDs, and select WinUSB on the right side of the arrow.
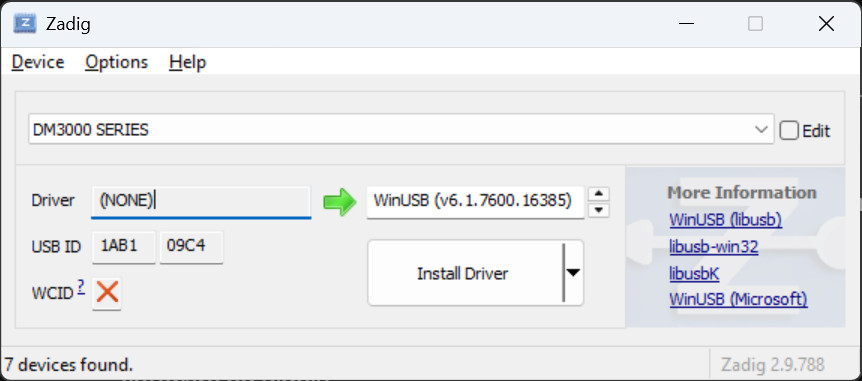
Click Install Driver (or Replace Driver when replacing an existing driver) and wait for completion. Apply this only to the intended instrument interface. Keep the serial driver for COM devices; do not select a USB hub, keyboard or mouse. Replacing a vendor driver may prevent the vendor's application from using that device until its driver is restored.
3. Verify and connect
Reconnect the USB cable if necessary and check Device Manager again. The example now appears under Universal Serial Bus devices without the warning icon. Return to Bench Logger, scan in USB mode, select the instrument and connect.
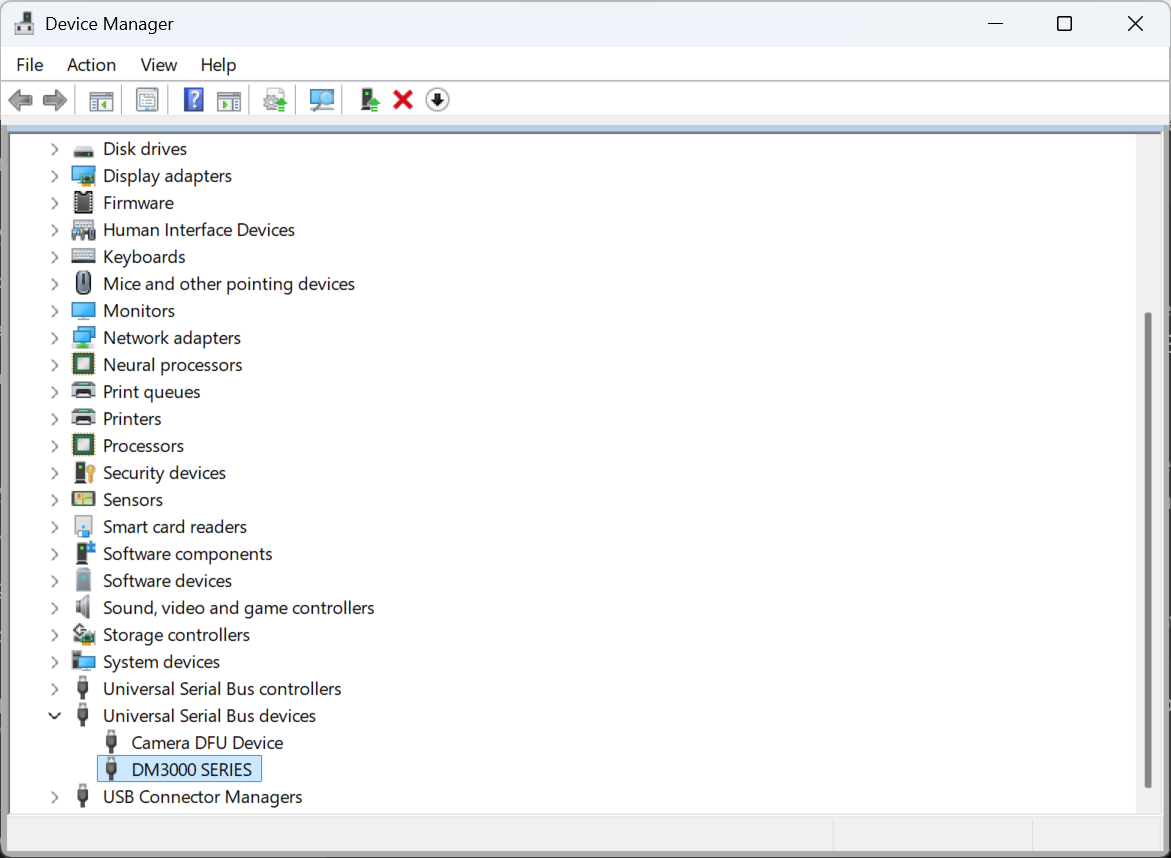
If you need the previous driver again, use Device Manager's driver selection or reinstall the manufacturer's driver. See the official Zadig guide for the tool's options.
Serial / virtual COM connection
- Find the instrument's COM port in Device Manager. Keep its serial or USB-to-serial driver installed.
- Choose Serial, enter the port (for example
COM3) and set the instrument's baud rate. - The current transport uses 8N1, no handshake and LF-terminated text. The instrument must accept and return text SCPI in this format.
- Click Connect, check the profile and select the measurements.
Zadig is for the USBTMC/WinUSB path above, not for converting a serial port into a USBTMC instrument.
Try without an instrument
Choose Simulator, select a profile and connect. Use Measurements and Live to explore selection, timing, plotting and CSV logging. Simulator output is synthetic and does not establish that the same profile works on real hardware.
Selecting measurements and writing CSV
- On Measurements, check the quantities to record.
- Set the interval in milliseconds. A query cycle may take longer than the requested interval.
- Enter a path in CSV output file or click Browse….
- If the path is empty, a timestamped file is created in Documents\BenchLogger.
- Click Start preview. Every completed cycle is flushed to CSV immediately.
The CSV contains profile and instrument metadata, UTC timestamp, elapsed time, sample number, GOOD/INVALID status and profile columns.
Process the CSV in MD Visor
CSV recording happens during acquisition: choose a path under Measurements before starting. Every completed measurement cycle is written and flushed to disk, so no separate export step is needed after the run. Click Stop to finish and close the recording before processing it.
The file uses UTF-8, commas between fields and a decimal point for numbers. Lines beginning with # contain profile and instrument metadata. The table starts with timestamp_utc,elapsed_s,sample,status, followed by the selected measurements' profile-defined column names. Units come from the instrument profile; they are not stored as a separate CSV row.
timestamp_utc,elapsed_s,sample,status,voltage_dc
2026-09-17T10:00:00.0000000Z,0,1,GOOD,5.012
2026-09-17T10:00:01.0000000Z,1,2,GOOD,5.014
2026-09-17T10:00:02.0000000Z,2,3,INVALID,
This abbreviated example shows the data table. The status column describes the whole measurement cycle (one CSV row):
GOOD: every selected measurement returned a reply that its parser could convert to a finite number.INVALID: at least one selected measurement timed out or could not be parsed as a finite number, for example because a CSV field was missing or the response contained unexpected text. The affected value is left empty, not replaced with zero. Other valid values in the same row are still recorded.
GOOD confirms successful reading and parsing. It does not certify measurement accuracy, calibration or compliance with your expected range. An instrument's numeric overload or error code can still be parsed as a number; interpret such codes according to its programming manual.
When processing the file in MD Visor or another tool, inspect status and treat empty values as missing data. Enable Stop on INVALID if acquisition should stop after writing the first invalid cycle.
- Open MD Visor and choose Create Report from CSV.
- Select the CSV recording. MD Visor skips metadata comment lines beginning with
#; use the comma delimiter if you need to choose it explicitly. - For a time plot, choose
elapsed_sas X and a measurement column such asvoltage_dcas Y. Set axis labels and units to match the profile and inspect missing or invalid readings. - Add charts, data tables and your description of the instrument, test conditions and conclusions to the report.
- Save the document and export to PDF, DOCX or HTML for sharing. Keep the original CSV alongside the report for later reprocessing.
The handoff uses the saved CSV file: open it in MD Visor yourself after the measurement. If file rotation or reconnect created several files, include the relevant recording segments. The same CSV can also be processed in a spreadsheet or an analysis script.
Acquisition limits
- Maximum samples: maximum number of cycles; 0 means unlimited.
- Maximum duration: maximum duration in seconds; 0 means unlimited.
- Stop on INVALID: stops after the first cycle containing an invalid response.
A limit is evaluated after the final cycle has been written to CSV.
Pause, Resume and Stop
- Pause lets the current SCPI cycle finish, then stops new queries.
- Resume continues the same run.
- Stop cancels acquisition and closes the CSV file.
Auto reconnect for LAN and serial runs
- Enable Auto reconnect in Settings.
- Set the delay and, if desired, the maximum consecutive attempts. 0 means unlimited.
- Choose a run log path with Browse….
After a failure, the current CSV is closed, the error is logged, the connection is restored, and acquisition continues in a new file named with -reconnect-YYYYMMDD-HHmmss. The run log records start, failures, reconnects, Pause/Resume, Stop and completion timestamps.
SCPI Console
Use the console for safe query commands such as *IDN? or a profile measurement query. It is disabled during acquisition so it cannot disturb query order. Responses and recent commands remain in the history.
Instrument profiles
See the step-by-step profile guide for the JSON structure, complete examples, parsers, setup commands and controls.
A profile defines instrument matching, SCPI queries, response parsers, units and CSV columns. ESP32 legacy v1 profiles are supported; v2 adds number/csv parsers and setup commands.
Imported profiles are saved to the user catalog and loaded again on the next start. The source JSON file is never modified.
Profile Editor v2
Open the Profile Editor v2 to import v1/v2 JSON, load predefined Rigol and ET/LCR profiles, edit query/parser/setup fields, and export v2 or legacy ESP32 JSON.
Before a legacy export, the editor warns about ESP32 limits and any CSV parser or setup command that cannot be preserved.
Recipes
- Open Recipes and enter a recipe name.
- Set the profile, quantities, interval, CSV path and limits.
- Click Save recipe.
- Select it later and click Load recipe.
Run log and file rotation
The run log is a tab-separated file with UTC time, event and details. The default rotation limits are 50 MB for CSV and 10 MB for the run log; both can be changed in Settings. Archived files receive a timestamp suffix.
Troubleshooting
- Discovery finds nothing: enter the IP manually and check the network, firewall and port.
- No profile matches: inspect the exact *IDN? response in the console.
- A value is INVALID: check the query, parser and response format.
- CSV cannot be created: choose a writable folder and check free disk space.
- ET/LCR values are wrong: check the A/B setup functions and the order of values returned by FETCh?.