AudioLab plays a test signal through a device and records its input and output at once – or reads a test record, test tape or test file the device plays. Distortion, noise, frequency response and crosstalk, both stereo channels together.
What it measures
Free from the Microsoft Store · Windows 10/11, 64-bit · developed and verified on a MOTU M4 – any audio interface with its manufacturer's driver works
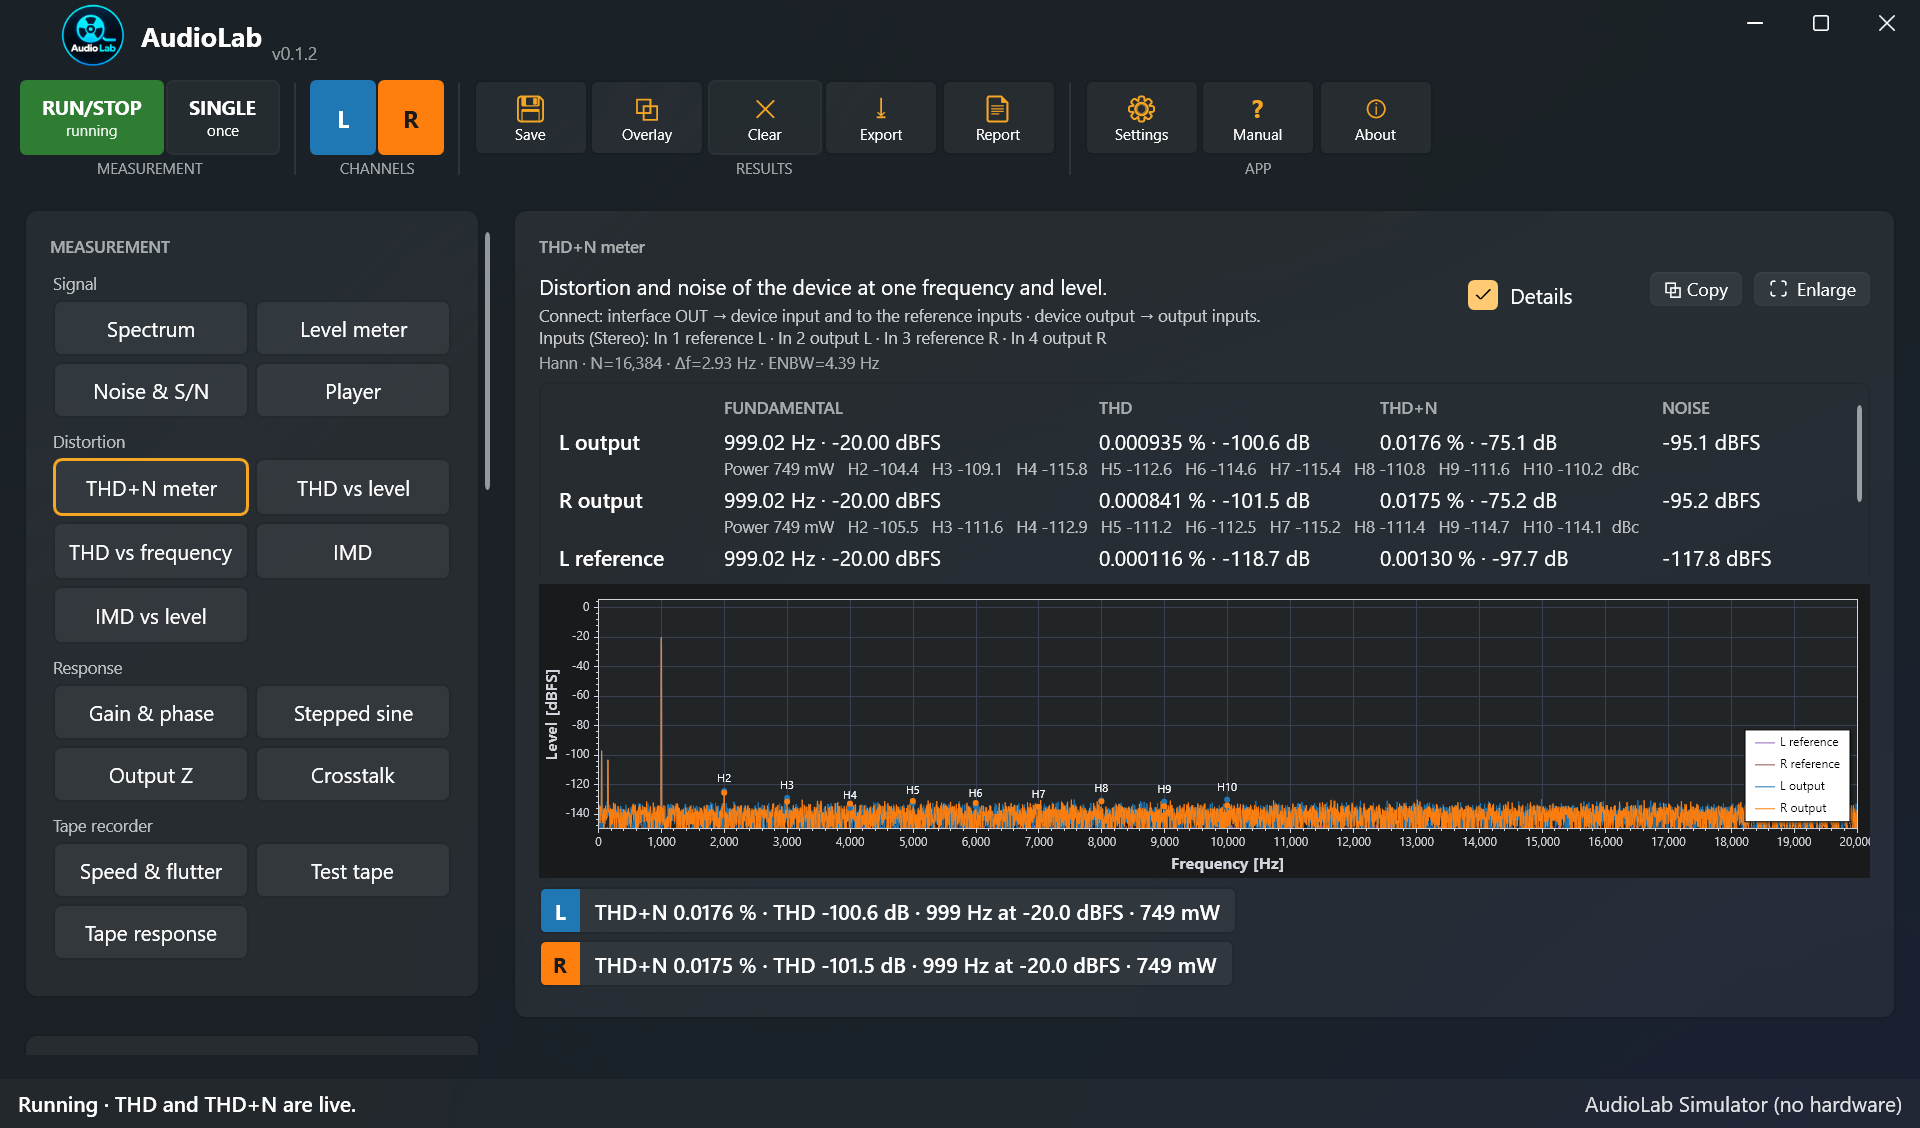
THD+N meter. Spectrum with marked harmonics; the bar under the chart shows THD+N and THD of each channel.
Play a test record and AudioLab takes you through the alignment step by step – speed, tracking force, anti-skating, azimuth: what is off, which way to turn it, which tracks to play again.
Turntable setup, step by step →
No measuring interface needed
A cheap USB sound card with a phono input can set a turntable up on its own – no ASIO driver at all. A few things it measures worse than a full interface, so read the pitfalls first: through a USB sound card →, with the card we measured → on its own.
Playback first, then recording: the head azimuth as the time between the channels, live while you turn the screw; speed and wow and flutter; then bias, record level and record EQ, recording and playing back at once.
One stylus reads two channels from the two walls of one groove – and what a leaning stylus, the tracking force or the anti-skating do to it.
Three heads, the bias that lets tape remember, the rollers behind wow and flutter, a tilted head as a time difference between the channels.
Your interface in a loop first – its floor tells you which figures belong to the device. Then a headphone amplifier through a load box, and a USB audio card as External ADC and External DAC, with the pitfalls met on the way.
Measure your interface first →
Headphone amplifier, step by step →
Measuring a USB audio card →
Full protocols of devices measured with AudioLab: the wiring, every setting, every reading with its chart and CSV, and what the setup itself limits.
AudioLab grew out of Python scripts written to service amplifiers and tape recorders at the workbench, driving a signal generator and an oscilloscope. It does the same work through an audio interface, by the methods described in the manual.
Technical reports from measurement data: charts and tables from CSV, equations and diagrams, export to PDF, DOCX or HTML – AudioLab's protocols open in it.
Frequency response, phase and distortion measured with a bench oscilloscope and function generator over LAN, saved as CSV.
Logging bench instruments over LAN, USB or serial (SCPI): live values and plots, recorded to CSV.
Free from the Microsoft Store. No interface at hand yet? The built-in simulator plays amplifiers, a tape recorder and a turntable to learn on.